4 {shinysurveys}
4.1 What is {shiny}?
4.1.1 Technical Aspects
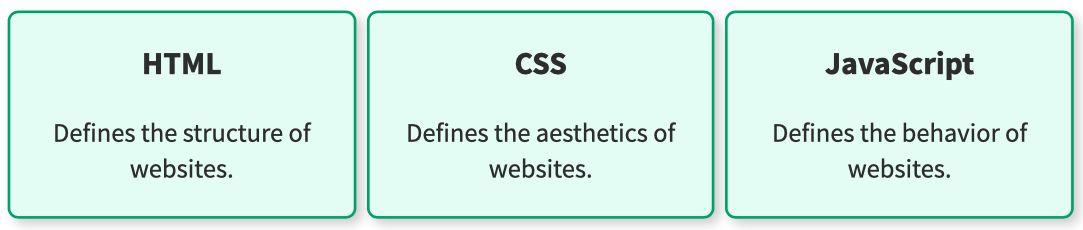
Websites are predominantly built using three languages, HTML, CSS, and JavaScript, as described in the following figure.
At a high-level, {shiny} allows programmers to combine the computational strengths of R with the interactivity of web applications. {shiny} provides a curated set of functions that generate the HTML, CSS, and JavaScript necessary to create web applications(Hadley Wickham 2020).
A simple {shiny} application consists of two elements: ui (user-interface) and server. The former, defines what an individual will see when they visit the application and the latter defines the computations performed. For example, you can define a simple application that accepts a name, adds a greeting, and displays the result using a few lines of code:
# load the package
library(shiny)

# define a user-interface with two elements: a text input with an ID,
# label, and initial value; define a textOutput that
# returns the input + greeting
ui <- fluidPage(
  textInput(inputId = "nameInput",
            label = "What is your name?",
            value = "World"),
  textOutput("name")
)

# define the server side logic to manipulate the inputs
server <- function(input, output, session) {
  # define the output that concatenates the strings
  # "Hello, " + user input + "."
  output$name <- renderText({paste0("Hello, ", input$nameInput, ".")})
}

# run the application
shinyApp(ui, server)
When run in a browser, this code produces the following application:
4.1.2 Usage
{shiny} is “used in almost as many niches and industries as R itself is” (Hadley Wickham 2020).
{shiny} is used in many disciplines. For example, DePalma, Turnidge, and Craig (2017) developed an application that allows physicians to utilize complex mathematical methods of determining microbial resistance to antibiotics(DePalma, Turnidge, and Craig 2017).
Similarly, Kandlikar and colleagues (2018) developed an application, ranacapa, to explore environmental DNA sequences that is used to engage and educate professionals and students alike. It allowed resource managers at the Channel Islands National Park Service to filter their observed species down to “a particular set of key taxa that they regularly monitor” and allowed students with “no prior bioinformatics experience” to gain an understanding of their eDNA samples, allowing their instructors to focus on “biological questions rather than on troubleshooting bioinformatics problems” (Kandlikar et al. 2018).
These two examples serve to illustrate the effectiveness of allowing people to ‘interact’ with R. The next section describes the specific motivation for {shinysurveys}.
4.2 Motivation
Surveys are useful tools for gathering information from individuals on a large scale and are used in a variety of domains. Within the medical research field, for example, they may be epidemiological questionnaires (e.g. have you received your COVID-19 Vaccine). In neuroscience research, they are often used to correlate behaviors such as political ideology with neuroimaging data (Ahn et al. 2014).
The ability to easily collect and analyze survey data is, therefore, incredibly important. Many platforms provide user-friendly methods to do this. Google Forms, SurveyMonkey, and Qualtrics are all popular options. For many cases, they work very well. However, existing services don’t always integrate with existing data analysis and/or research pipelines easily. Because of R’s prevalence in academia and research (RStudio 2018b; Carson and Basiliko 2016), {shinysurveys} was developed to streamline the data collection and analysis process. It is built upon the {shiny} package (Chang et al. 2021) previously described.
4.3 A survey of {shinysurveys}
Surveys are ubiquitous in data science. A clear example is a simple demographic form. Our package allows you to easily create questionnaires using {shiny}.4 This vignette introduces you to the main functionality of our package as it is currently published on CRAN.5 Recalling the basic structure of a {shiny} application, consisting of the user-interface and server components, {shinysurveys} has a function for each: surveyOutput() and renderSurvey(). Both of these take in a data frame containing question information that follows a specific format. To illustrate them in use, we will show you a questionnaire from a recent study conducted by the D’Agostino McGowan Data Science Lab that is built into the shinysurveys package.6 The first ten (of 54) rows of this data frame look like:
This data can be described as a tidy data frame, where each row is a unique observation and each column is a variable. While the full table consists of 54 rows, there are only 11 unique questions:
Each question has seven parameters that dictate its functionality within {shinysurveys}. They are described in the package documentation and can be accessed by typing ?shinysurveys::teaching_r_questions in your console:
- question: The question to be asked.
- option: A possible response to the question. In multiple choice questions, for example, this would be the possible answers. For questions without discrete answers, such as a numeric input, this would be the default option shown on the input. For text inputs, it is the placeholder value.
-
input_type: What type of response is expected? Currently supported types include
numeric,mcfor multiple choice,text,select,andy/nfor yes/no questions. - input_id: The input id for Shiny inputs.
- dependence: Does this question (row) depend on another? That is, should it only appear if a different question has a specific value? This column contains the input_id of whatever question this one depends upon.
- dependence_value: This column contains the specific value that the dependence question must take for this question (row) to be shown.
- required: logical TRUE/FALSE signifying if a question is required.
The reason for the discrepancy between the number of rows and unique questions derives from the fact that certain questions can have more than one possible response. For example, the multiple choice question asking about gender has four options: “Female”, “Male”, “Prefer not to say”, or “Prefer to self describe.” It thus has four rows, one per each option. The next section describes input types native to {shinysurveys}.
4.3.1 Examples
Below are examples of the currently supported question types. We provide a thorough explanation for the numeric input, but only point out notable differences for other inputs.
4.3.1.1 Numeric Input
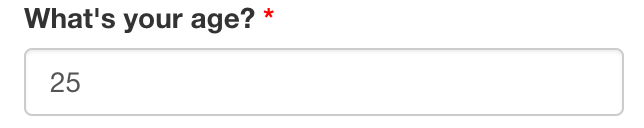
A good example of a numeric input is the first question: “What’s your age?”:
As noted above, this row shows us that the question is “What’s your age?”. We know we are expecting a numeric input by looking at the input_type column, and the default value is equal to 25 according to the option column.7
We can also tell that there are no dependency questions. This means that no matter what value you enter, no follow-up question will appear. Lastly, we know this is a required question.8
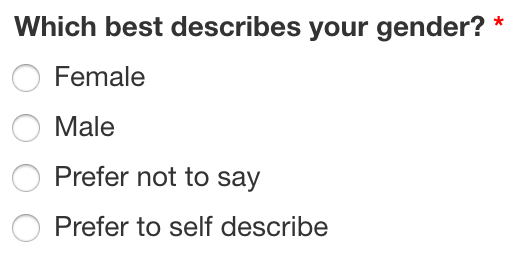
4.3.1.2 Multiple Choice (mc) Input
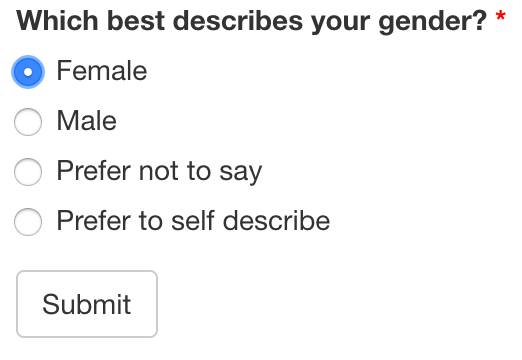
An example of this is the question “Which best describes your gender?”:
Unlike numeric inputs, the option column represents each of the possible responses for this question. You may notice that the fifth row of this question has NA in the option column and “text” in the input_type column. We will discuss this in more detail below, but for now note that this question has a dependent. That is, if a specific option is chosen for this question, a new one will appear below. In this case, a question that accepts text as its input.
4.3.1.3 Text Input
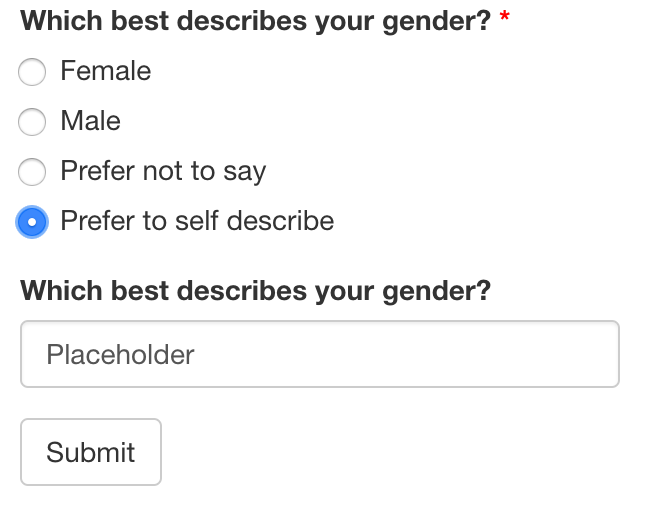
Questions that need text-based input should specify “text” in the input_type column. As noted in the previous example, the following is a dependent of the question “Which best describes your gender?”:
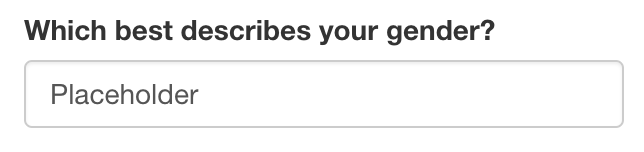
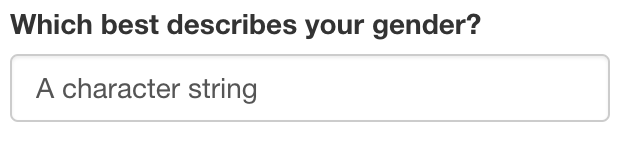
It’s important to note that, as previously mentioned, the option column for text-based inputs corresponds to a placeholder value. It can be left blank (i.e. NA) or contain a character string. If they are left empty, the text field will display “Placeholder” as seen below. Otherwise, the character string will be displayed.
4.3.1.4 Select Input
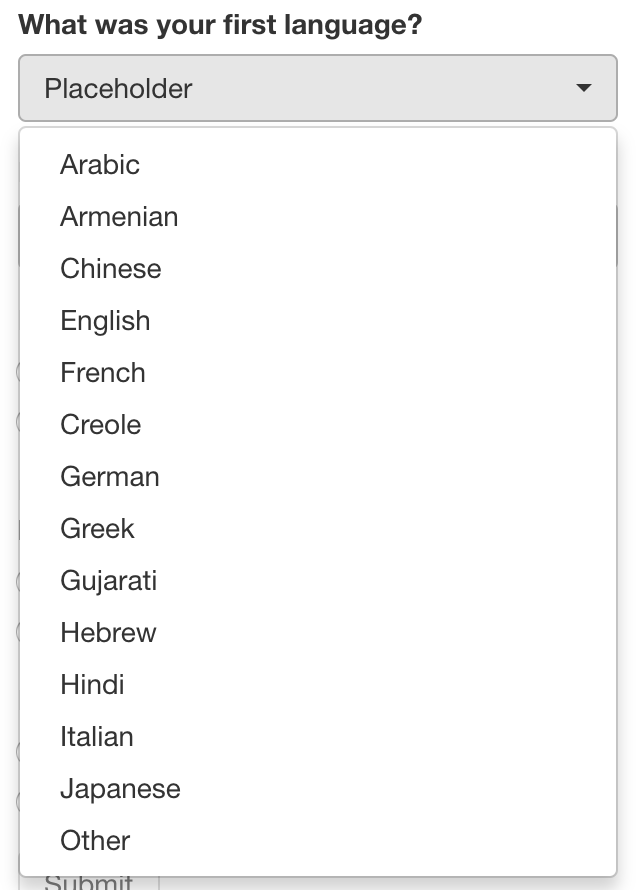
Select inputs are great when there are many potential, discretely defined, response choices.9 An example is the question “What was your first language?” which contains 15 options:
4.3.2 Implementing Surveys in Shiny
4.3.2.1 UI Function
surveyOutput() takes in a data frame of the form described above. You may also add a title and description for your survey with the arguments survey_title and survey_description, though these are optional. Further documentation can be accessed by typing ?shinysurveys::surveyOutput() in the console.
4.3.2.2 Server Function
renderSurvey() takes in a data frame of the form described above. It also takes in a theme color to style your survey. Typical names such as “red” or “blue” work, as well as hex color codes such as “#63B8FF” (the default theme). The documentation for it can be accessed by typing ?shinysurveys::renderSurvey() in the console.
4.3.2.3 Basic Survey
A minimal example of a survey can be created with this template:
library(shinysurveys)
ui <- shiny::fluidPage(
  shinysurveys::surveyOutput(df = shinysurveys::teaching_r_questions,
                             survey_title = "A minimal title",
                             survey_description = "A minimal description")
)

server <- function(input, output, session) {
  shinysurveys::renderSurvey(df = shinysurveys::teaching_r_questions)
}

shiny::shinyApp(ui = ui, server = server)
Please note that the UI comes with a “Submit” button included. Survey designers can customize actions by using the call input$submit. Some examples would be saving or displaying user responses, or displaying a message as seen on the gif here.
4.3.3 Advanced Features
4.3.3.1 Dependency Questions
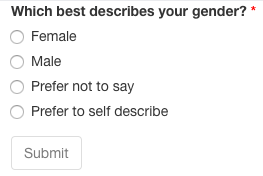
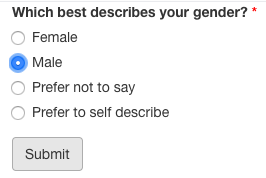
I use the term question dependencies in reference to the situations where a question should only be shown (i.e. asked) if a specific response is given to a preceding question. The questions included with the shinysurveys package contain many dependencies. One example we’ve seen discussing multiple choice and text-based questions is the dependent for “Which best describes your gender?”
Focusing on the columns dependence and dependence_value, we see that the text-based question will only show if the multiple choice one, with the input id of “gender” takes on the value “Prefer to self describe.” That is, a question with non NA values in the dependence and dependence_value columns mean that it will only show if the question with the input id from dependence takes on the value from dependence_value. This can be seen below:
4.3.3.2 Required Questions
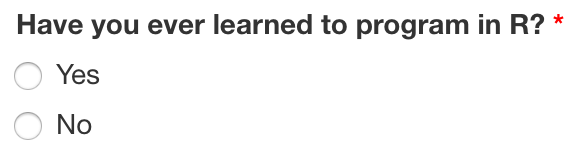
Survey designers can define questions that must be answered by adding the value TRUE to the required column. If a required question is not answered, the user will not be able to submit their responses.
4.3.3.3 User Tracking
Built into the survey is the ability to track users based on URL parameters. If you deploy your survey on shinyapps.io, or run it locally in a browser, you can add a URL parameter after the backslash as follows: ?user_id=12345. A live demo can be found here: https://jdtrat-apps.shinyapps.io/shinysurveys_user_tracking/?user_id=hadley
4.4 Conclusion
{shinysurveys} was developed to integrate behavioral data collection into existing research and/or analysis pipelines in R. The package provides an easy-to-use, highly customizable framework for deploying surveys and questionnaires via web applications. By extending the {shiny} package, a shinysurvey can make use of the data manipulation and visualization tools in R, facilitating automated data analysis and real-time metrics for participant responses.
In its current implementation, {shinysurveys} is a powerful tool. Amazingly, as of May 11, 2021, the package has been downloaded over 1,000 times. The original idea for it was to provide a select set of well-supported input types commonly used in surveys. However, it was not designed to meet every use-case, and shortly after its release, new question-types were requested (see GitHub Issue #6 or #18).
In order to make the package as light-weight as possible, minimizing the dependence on external code, I did not wish to implement any input types not native to {shiny}. While some additional inputs have been addressed in the development version, future work will focus on providing a method to extend possible input types. The ability to extend {shinysurveys} with custom inputs, from packages such as {shinyWidgets}, will allow users to administer more complex surveys.